Series 1: Optimizing Complex DATAVERSE-Semantic Models in Power BI
By Zonaira Khairi
In the world of CRM reporting, creating high-performance, reliable Power BI dashboards can be challenging—especially when working with complex Dataverse-based data models. Did you know poorly optimized Power BI reports can drastically impact decision-making by increasing refresh times and slowing down insights?
I recently faced significant hurdles while optimizing Power BI reports for a D365 Sales CRM project. The data model included over 25 interconnected tables, and some reports required combining data from two distinct data sources. These complexities led to inefficiencies, slow refresh times, and challenges in maintaining consistency across reports.
By addressing these challenges with targeted optimizations, I transformed the reports into efficient, scalable solutions. In this blog, I’ll Walk you through the steps I took to overcome these obstacles and share practical tips to help you achieve the same.
The first part introduces the challenges and steps to optimize semantic models, with a detailed focus on foundational improvements like streamlining semantic models, moving logic from DAX to Power Query, and optimizing relationships.
Steps Taken to Optimize Power BI Reports
1. Streamlined Semantic Models:
Centralized shared logic into fewer semantic models, reducing duplication, inefficiencies, and maintenance effort.
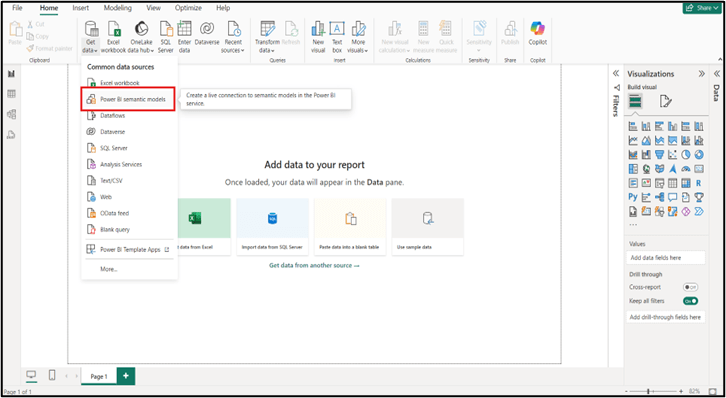
Step 1: Get Data from existing Semantic Model
In Home tab get data from semantic model
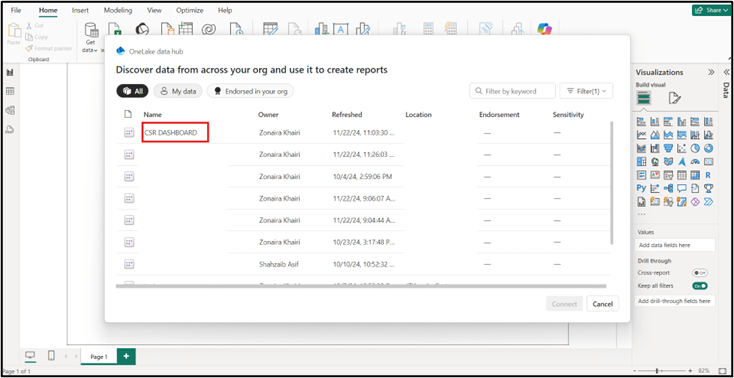
Step Step 2: Connect with Semantic Model
You will get all the published semantic models, and you can select an existing semantic model you want to use and connect.
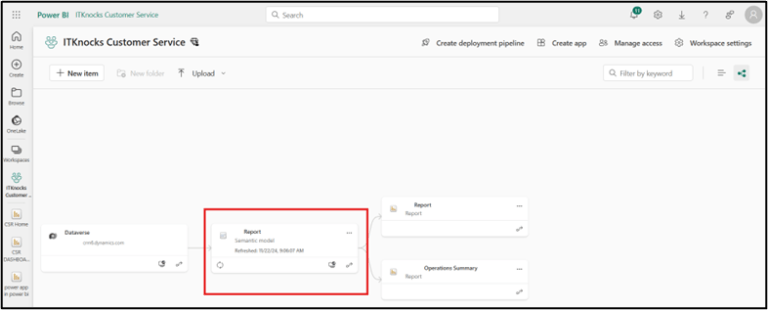
After publishing the report, you can go to the Power BI service and see that two reports are created using one semantic model.
2. Shifting Logic from DAX to Source or Power Query
Key tables were being created directly using DAX code, such as Bridge table. This approach increased model complexity and slowed performance. Tables created using DAX were replaced with transformations in Power Query or Dataverse queries. This shift improved model performance.
3. Integrating Incremental Refresh for Performance Optimization
For large datasets, I configured incremental refresh to load only new or updated records. This drastically reduced the refresh time and resource usage.
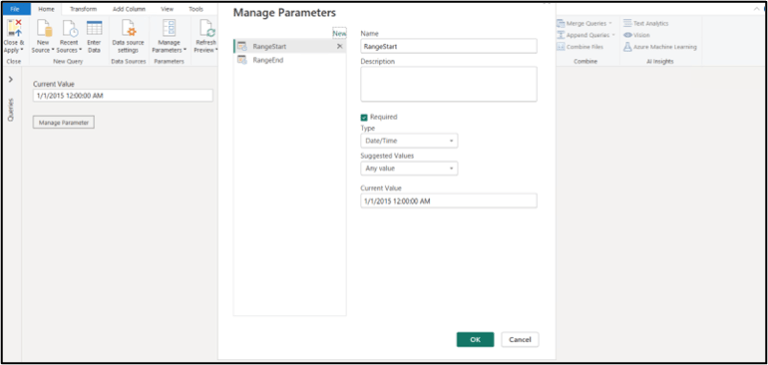
Step 1: Create Parameters
Go to “Home” > “Manage Parameters” > “New Parameter.”
Create “RangeStart” and “RangeEnd” parameters with data type “Date/Time.”
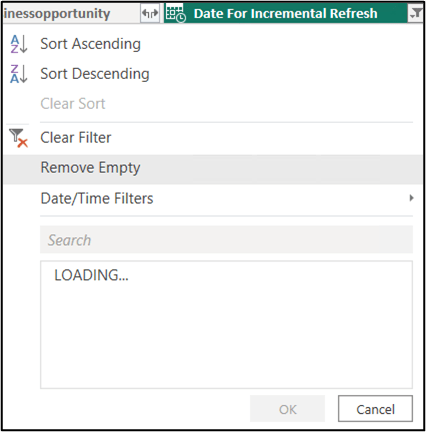
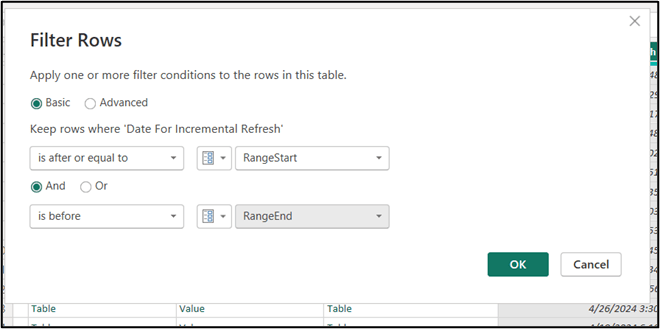
Step 2: Apply Parameters to Date Columns
In “Query Editor,” filter the date column using parameters:
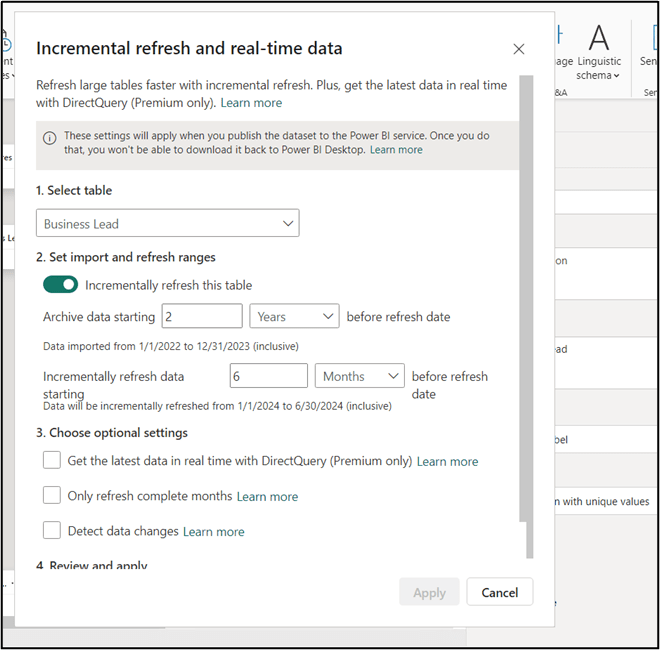
Step 3: Configure Incremental Refresh
Right-click on your dataset in the “Fields” pane and select “Incremental refresh.”
Configure settings for historical data and refresh frequency.
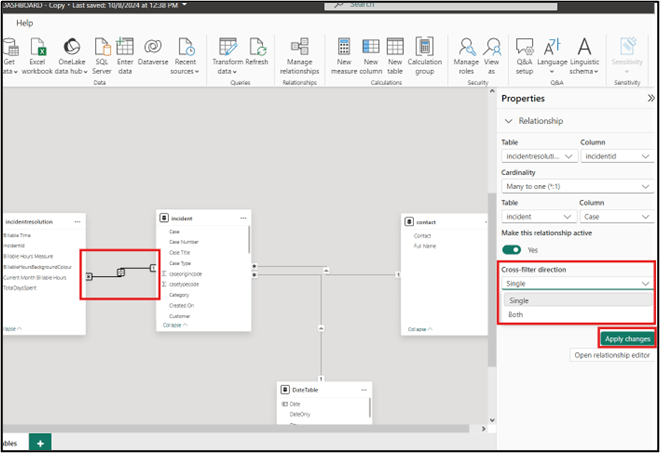
4. Optimizing Relationship Filters for Efficient Data Modeling
Many relationships were set to bi-directional cross-filtering, which unnecessarily consumed resources and created performance bottlenecks.
Changed most relationships to single-directional filtering to minimize resource consumption.
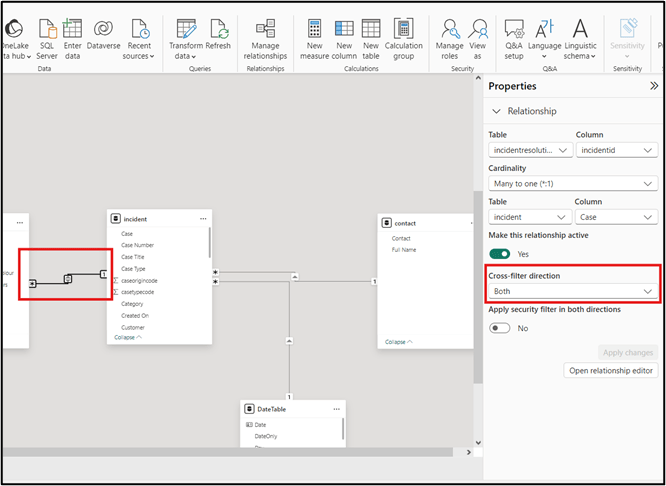
Step 1: Identify Tables with Bi-directional Relationships
Locate the tables that have bidirectional relationships in the model view.
Step 2: Cross-Filtration into Single Direction
Select the relationship and cross-filter>single then apply changes.
Conclusion: Wrapping Up Foundational Optimizations
Optimizing Power BI reports for complex Dataverse-based semantic models can be daunting, but the results are transformative. By streamlining semantic models, shifting logic to Power Query, and optimizing relationship filters, I was able to significantly enhance the performance and maintainability of reports. These foundational improvements have laid the groundwork for faster refresh times, simplified data models, and scalable solutions.
While this first part focused on essential steps to address inefficiencies, the journey doesn’t end here. In the next blog, I’ll dive into advanced optimizations such as integrating incremental refresh, enhancing time intelligence, and transitioning to explicit measures. These techniques will take your Power BI reports to the next level, ensuring even greater performance and usability. Stay tuned!
At ITKnocks, we are more than an IT consulting company; we’re your strategic partner in business evolution. With a global footprint and a passion for technology, we craft innovative solutions, ensuring your success. Join us on a journey of excellence, where collaboration meets cutting-edge IT expertise.